Call statistics help you improve how your teams' performance is analyzed. 📈 Filter your call analytics to analyze the performance of a user or a group of users, for example. You’ll then be able to more effectively monitor essential performance indicators on your teams and produce detailed reports. 📝
Note:
- In-depth analytics are available for the Business and Advanced packs.
Related article: "Understanding the Heatmap"
Understand your call analytics
🖥️ From your Dashboard, go to the “Call analytics” section of the “Analytics” menu. This will allow you to view all analytics on your calls 📊 :
1. Service Level
Represents the percentage of answered calls relative to the total number of incoming calls received. Two levels are differentiated:
- Basic mode: only considers calls answered within a given timeframe, without other criteria.
-
Advanced mode: includes calls answered within the timeframe and:
- missed calls that were called back,
- masked calls (private numbers),
- internal calls (between colleagues).
🔎 This advanced mode provides a more complete and fair view of actual performance by highlighting callback efforts and internal collaboration.
2. Total Number of Calls
Total volume of processed calls, divided into outgoing and incoming calls.
Outgoing calls:
- Answered: Calls received by an agent or redirected to a voicemail.
- Unanswered: Failed attempts — no ringing on the recipient’s side, early hang-up or connection failure.
Incoming calls:
-
Answered: Calls received either by an agent or by an IVR system, provided that the “Consider as missed” option is disabled.
👉 Important: internal calls (between colleagues) are not counted. - Missed: Calls not picked up by an agent or by the IVR system, with the “Consider as missed” option enabled.
🔎 This distinction allows for a nuanced view of call handling quality, by separating genuine missed calls from those automatically routed or managed.
3. Total Call Duration
Breakdown of the cumulative duration of all incoming and outgoing calls.
- Only takes into account the actual talk time, excluding wait time.
- Used to measure the actual volume of voice exchanges, and thus the team engagement over the analyzed period.
🔎 A key indicator to assess the operational workload related to call handling.
4. Average Wait Time
Average wait time before the call is answered by an agent.
- Reflects the ability of the phone system to handle calls in a timely manner.
- Excessive wait times may lead to abandoned calls and a drop in customer satisfaction.
🔎 A key metric for optimizing service responsiveness and improving the caller experience.
5. AHT (Average Handling Time)
Average duration of effective phone conversations.
- AHT (incoming): Average talk time for incoming calls, often longer due to support-related issues or inquiries.
- AHT (outgoing): Average talk time for outgoing calls, typically shorter, focused on sales or follow-ups.
🔎 Helps evaluate the nature and complexity of interactions handled by the team.
6. Missed Call Handling Status
Analysis of how calls not answered by an agent are managed.
- Only one count per missed call: even if several agents don’t pick up, the call is counted only once.
- To be handled: only includes calls not answered and considered relevant (excluding IVR).
- Not applicable: calls that cannot be handled, such as those from anonymous numbers or internal transfers.
💡 Example:
- A client calls 5 times from the same number → this counts as 5 missed calls.
- As soon as an agent successfully calls back → all 5 calls are considered handled.
🔎 This metric reflects the ability to follow up after a missed call and the effectiveness of callbacks. It excludes automated or unworkable cases.
Learn more about the "Why do my statistics differ between the global page and the leaderboard?".
7. Channel-Based Handling
Indicates the communication channel used to follow up on missed calls.
Possible channels include:
- Phone (direct callback),
- SMS,
- Email,
- or no follow-up (ignored call).
🔎 Helps analyze the callback strategy and the use of available channels to maximize re-contact opportunities.
8. Average Callback Time
Average time it takes for an agent to call back after a missed incoming call.
- This delay is calculated only for phone callbacks.
- Follow-ups done via SMS or email are not included in this metric.
🔎 This indicator helps assess the team’s responsiveness after a missed contact, focusing on direct phone callbacks.
History
You also have the option of viewing your analytics as graphs 📈. Change the type of graph (line, area or bar) along with the call data to display, then select the interval for which you want to display this data.
You will find the following filters:
- Total calls
- Service level
- ACD
- Total call duration
- Avg. wait time
- Total wait time
- Advanced service level
- Unique callers
- Avg. abandon time
Filter your call analytics
Filter by countries
You have the option to filter your call data to display activity only from your extensions or direct lines and for the selected country or countries. If you wish to add more countries to your selection, click on the '+' button next to the countries.
Filter all call analytics
You have the option to filter your call data to only display activity from your main lines or your direct lines and over a specified period.
To do this, click on 'edit filters', choose whether you want to display analytics for all calls, only from main lines, or from direct lines.
You may also wish to customize your filters:
- Set the type of notes and tags
- Set the period for which you want to display your data
You can filter calls even more precisely, deciding to display or exclude certain calls, defining how you want transfers to be considered, or even filtering calls by assigned tags 👁️ :
Filter call analytics for your IVRs
You can also expand the tree structure of a main line and filter on one or multiple forwards, or even a specific number if there are several on your main line.
- To do this, go to Dashboard > Logs > Call Log
- Filter your search to display the desired main line(s)
- Click on 'More' next to the name of the main line
- Choose the forward(s) as well as the number(s) for which you want to refine your filters
- And select 'Refine search'
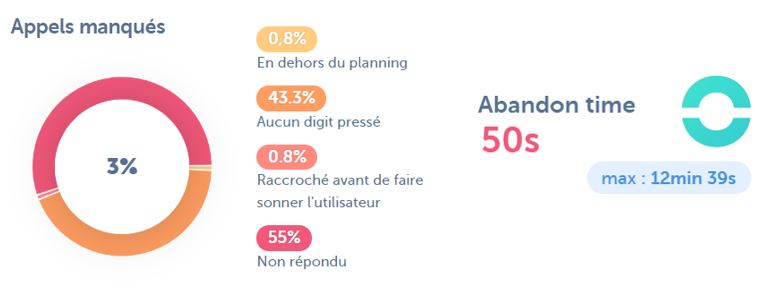
If you choose to display only IVR call data, 3 additional types of data will be suggested 📊 :
- The reasons why your calls were missed
- The average time before call abandonment (and the maximum time before abandoning)
- Call analytics for users associated with your IVR
Here are the terms used for the call analytics of users associated with your IVRs 💬 :
- OUT: the number of outgoing calls made with the IVR number.
- ANSWERED: the user answered the call.
- TOOLATE: 2 users picked up at the same time.
- CALL_ANSWERED: The call was initially missed by the user, but: either another user answered the call, or the same user eventually answered it after missing it at first.
-
NO_ANSWER: The call was not answered: no user picked up the call, it ended automatically after the attempt timed out.
- REJECTED: The call was manually declined by the user through an explicit action (e.g., clicking "Decline").
- INCALL: the user was already on a call.
- SNOOZE: the user was unavailable.
- PLANNING: the call came in outside the user's hours.
- NOTCONNECTED: the user was disconnected.
-
SIP PHONE ERROR => These are all call statuses that do not fall into the other categories of the leaderboard:
- Issue with the SIP phone (most common);
- User in between two statuses (equivalent to the label 'user_busy' that you might find in the logs). Examples: a user who is in the process of ending a call and is not yet fully available while the page is refreshing; or another call is ringing or about to start ringing (recording announcement message); or the user is part of multiple queues, and the system is already offering them a call; or the user has rejected the call from the mobile application...
Receive regular reports on your saved filters
In the call stats, the feature allows exporting statistics as an image with the following specifics:
- Take into account the current filters
- Date picker to select the frequency
- Option to choose the frequency (daily, weekly, monthly)
- Send the report to the user who requested it
- The user can unsubscribe from a previous subscription
To activate these reports:
- Click on "Edit filters".
- Click on "Your filters".
- Click on the 'mail' icon next to the saved filter for which you want to activate the reports.
Note: For this option to be available, your filter must contain the criteria "yesterday", "last week" or "last month".