Enhance the analysis of your teams' performance with SMS analytics. 📈 Efficiently manage the performance indicators related to your SMS sends and generate detailed reports. 📝
Related article: "Understanding the Heatmap"
Understanding your SMS analytics
🖥️ Go to your Dashboard> Analytics> SMS Analytics
You will then be able to view all your SMS analytics 📊:
- Total SMS: Total number of SMS sent and received over a given period (direct SMS and SMS campaigns).
- Total fragments: Total number of fragments sent and received over a given period (one fragment consists of 160 characters; an SMS can contain multiple fragments).
- Average response time: Average response time for all messages sent.
- Unanswered SMS: Number of SMS sent by the correspondent that did not receive a response.
At the bottom of the page, a table allows you to easily view the main SMS users and the balance between incoming and outgoing SMS.

Understanding the heatmap
The heatmap 🌡️ is a feature that allows you to track your activity and service level hour by hour throughout the week. Analyze and anticipate your resource needs to improve the quality of your service!
- 🖥️ Go to your Dashboard> Analytics> SMS Analytics
- Scroll down to find the 'Heatmap' chart
Note : When the color is more intense, it indicates that at that moment of the day, your users experienced a higher workload compared to other times of the day. 💡
- Select the indicator you wish to view: total SMS, incoming SMS, outgoing SMS, total fragments, incoming fragments, outgoing fragments, or SMS campaigns
The heatmap then displays the data hour by hour 🕐 throughout the week. The color code helps you identify peaks in activity and the performance of your service (unanswered SMS, SMS sent and received...). 📅
Note : When the color is more intense, it indicates that at that moment of the day, your users experienced a higher workload compared to other times of the day. 💡
There you go, you know now how to filter and analyze your SMS statistics to continuously improve your teams’ performance. 🎉
Filtering your SMS analytics
You can filter your SMS data to display only the activity of your standards or direct lines over a given period.
- Click on "Edit Filters" at the top of your page,
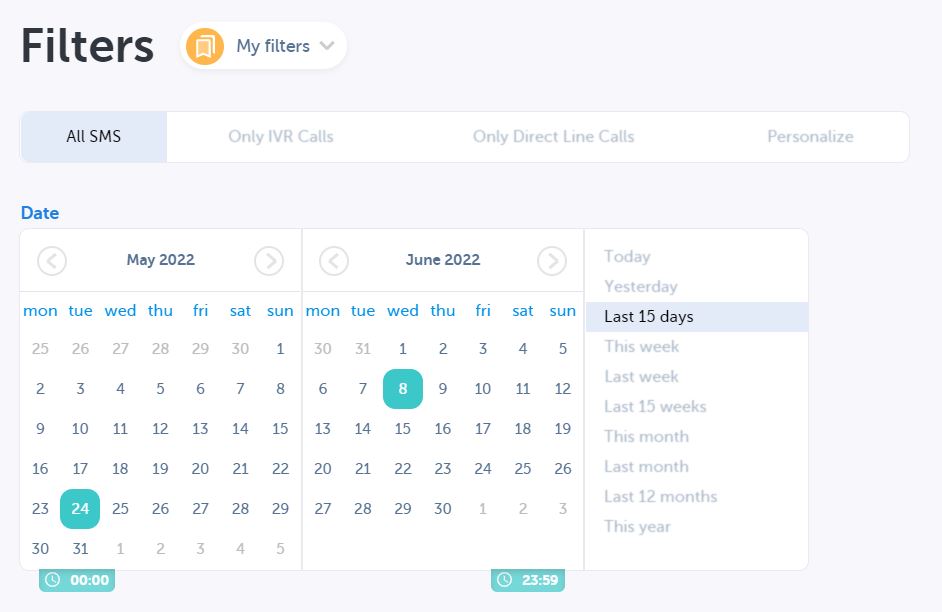
- Choose whether you want to display analytics for all SMS, only standards, direct lines, or customize your filters
- Define the period for which you want to display your data
In the "Customize" section, you can filter by IVRs, groups, and users.

