Thanks to Omnichannel analytics, improve your team's performance analysis. 📈 Effectively manage performance indicators related to your message deliveries across different platforms and generate detailed reports. 📝
Related article: "Understanding the Heatmap"
Understand Your Message Statistics
To begin with, 🖥️ go to your Dashboard, under the Omnichannel analytics section of the 'Statistics' menu. Here, you can visualize all your message statistics 📊:
- Total messages: total number of messages sent and received over a given period (across all channels).
- Average response time: average response time for all messages sent.
- Unanswered messages: number of messages sent by the correspondent but not answered.
You also have the option to display your statistics in graph form. 📈 You can change the time interval for displaying this data.
At the bottom of the page, you'll find a table to help you easily see the top message users as well as the balance between inbound and outbound messages.
Understand the Heatmap
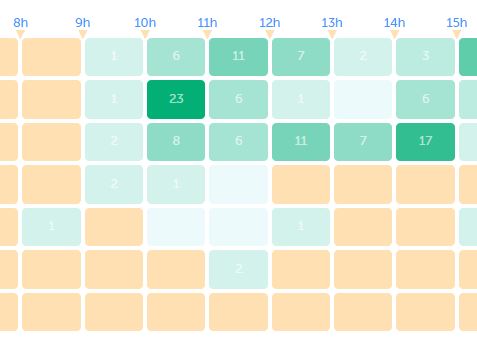
The Heatmap 🌡️ is a feature that allows you to track, at a glance, your activity and service level hour by hour throughout the week. Analyze and anticipate your resource needs to improve the quality of your service! 🚀
How to access it? Go to the Omnichannel analytics section of your Dashboard. On the 'Heatmap' graph, choose the indicator you want to visualize: total messages, inbound Omni-channel messages, or outbound Omni-channel messages:
The heatmap then displays the data hour by hour 🕐 throughout the week. And the color code allows you to identify activity peaks and the performance of your service. 📅
Filter Your SMS Statistics
You have the option to filter your message data to only display activity from certain omnichannels and over a specific period.
To do this, click on "edit filters", choose from your omnichannels, and then set the period for which you want to display your data:
Now you will know how to analyze your omni-channel message statistics. 🎉
